Earlier this year, American Trucking Associations (ATA) President and CEO Chris Spear testified before the Senate Commerce, Science and Transportation Committee about the urgent need to address the nation’s failing infrastructure. “Truck drivers are on the front lines,” he said. “Each day, they see potholes getting deeper, bridges getting weaker.
“Trucking now loses $74.5 billion sitting in gridlock,” Spear added. “That equates to 1.2 billion lost hours or 425,000 truck drivers sitting idle for an entire year. Those are the regressive costs of doing nothing.”
And ATA is not alone in voicing its concern about how road conditions impact the trucking industry. In 2016, according to the American Transportation Research Institute’s (ATRI) Research Advisory Committee, congestion is estimated to have caused the trucking industry to consume an additional 6.87 billion gallons of fuel.
That represented approximately 13% of the industry’s fuel consumption and added $15.74 billion to its fuel bill, ATRI noted. The added fuel consumption also resulted in 67.3 million metric tons of excess carbon dioxide (CO2) emissions.
How poor is the condition of America’s roads? Every four years, the American Society of Civil Engineers issues a Report Card for America’s Infrastructure. Assigning A-F letter grades based on the physical condition of infrastructure assets and needed investments for improvement, in 2017 it gave roads a failing grade.
The American Road & Transportation Builders Association (ARTBA) cites two measures that are used to assess the condition of the nation’s highways. One focuses on whether roadways and bridges are in good repair.
According to ARTBA, the latest data from the Federal Highway Administration (FHWA) indicates that 16.1% of the more than one million miles of highways eligible for federal funding are in poor or mediocre condition and need repaving or more substantive repairs. Not surprisingly, highways in urban areas, which carry more traffic, are in somewhat worse condition than those in rural areas.
ARTBA also noted that there is no information on the condition of the 3.1 million miles of local roads and rural minor connectors that are not eligible for federal aid. However, if the same 16.1% were in poor or mediocre condition, then more than 500,000 miles of those roads would be in need of repair.
Also of great concern is the condition of the nation’s bridges. FHWA’s 2015 National Bridge Inventory, ARTBA reported, shows that 9.6 percent of the country’s 609,539 bridges are structurally deficient, which means they are safe to use but need significant maintenance or repair to remain in service.
The other focus of ARTBA is on-road performance, meaning whether the system is providing adequate transportation services to meet the nation’s needs. One key measure that is used as a determination is the amount of congestion.
Referring to the Texas Transportation Institute’s Urban Mobility Scorecard from 2015, ARTBA noted that congestion caused Americans to spend an extra 6.9 billion hours in cars and trucks in 2014 and to purchase an extra 3.1 billion gallons of fuel at a cost of $160 billion. Of that total, $28 billion represented the impact of congestion on the US trucking industry.

A failing road infrastructure has a ripple effect across America’s economy. An infrastructure in poor condition affects business productivity in every region of the US because when one part of the system fails, the losses spread. In particular, when trucking costs rise the price paid for many goods and services increases as well.
The US economy relies on low transportation costs and with failing roads, higher costs for trucking operations in productivity, fuel and repairs lead to higher freight rates and ultimately higher prices for goods. Greater costs to transport a wide array of exports and the imported goods that supply domestic manufacturers also affect the ability of US companies to compete in global markets.
According to data from a 2013 US Department of Transportation report, the government should be investing $95.6 billion just to maintain current physical and performance conditions on the nation’s highways and bridges. That number would grow to $184.2 billion by 2020.
At the federal level, however, highway spending has stabilized at a level that is still 23% less (in inflation-adjusted terms) than it was in 2002. Furthermore, funding for highway projects expires in the fall of 2020, and revenue from federal fuel taxes is widely believed to be insufficient to sustain the Highway Trust Fund, the account used to assist states. In some states, in fact, rather than increase fuel taxes to finance highway improvements, governments have been borrowing money by issuing bonds or expanding their use of general revenues.
On Capitol Hill again, ATA’s Chris Spear told the House Ways and Means Committee that the nation’s infrastructure needs demand real funding solutions. “We are no longer facing a future highway maintenance crisis – we’re living it,” he said. “In nearly 53% of highway fatalities, the condition of the roadway contributed. Time wasted sitting in traffic has skyrocketed. Motorists now pay an average of $1,600 due to repairs and congestion each year. The escalating costs that are reflected in the prices we pay are measurable and should serve as offsets for new spending on our nation’s infrastructure.”
Roads and Government: A Call to Action
Across the legislative landscape, a myriad of groups is insisting Congress advance long-term infrastructure funding legislation this year. Speaking out along with trucking associations are AASHTO (American Association of State Highway Transportation Officials), the US Chamber of Commerce, the National Association of Manufacturers, the American Society of Civil Engineers and the American Road & Transportation Builders Association.
House and Senate transportation committees have been holding hearings aimed at addressing the nation’s infrastructure needs but transportation policymakers on Capitol Hill have yet to outline their vision for infrastructure legislation. While the new Congress and the White House kicked off 2019 saying that funding for infrastructure projects will be a top priority, transportation policymakers continue to disagree on the best approach for securing dollars in a federal highway account headed for insolvency in fewer than two years.
Among the possibilities are a nationwide vehicle-miles-traveled program, and increasing fuel taxes. While unpopular, some stakeholders argue that raising the federal 24.4-cents/gallon diesel tax and the 18.4-cents/gallon gas tax would be an ideal approach for restoring the long-term solvency of the Highway Trust Fund.
Canada also faces challenges relating to an aging road and highway infrastructure. In that country as well there is increased pressure for more federal, provincial and municipal spending.
Also in Canada, economic circumstances are forcing governments to consider new and innovative ways to fund transportation needs. Through the Investing in Canada plan, for example, the Canadian government is making infrastructure investments, including spending on transportation systems.
Roads: Ranking Highways
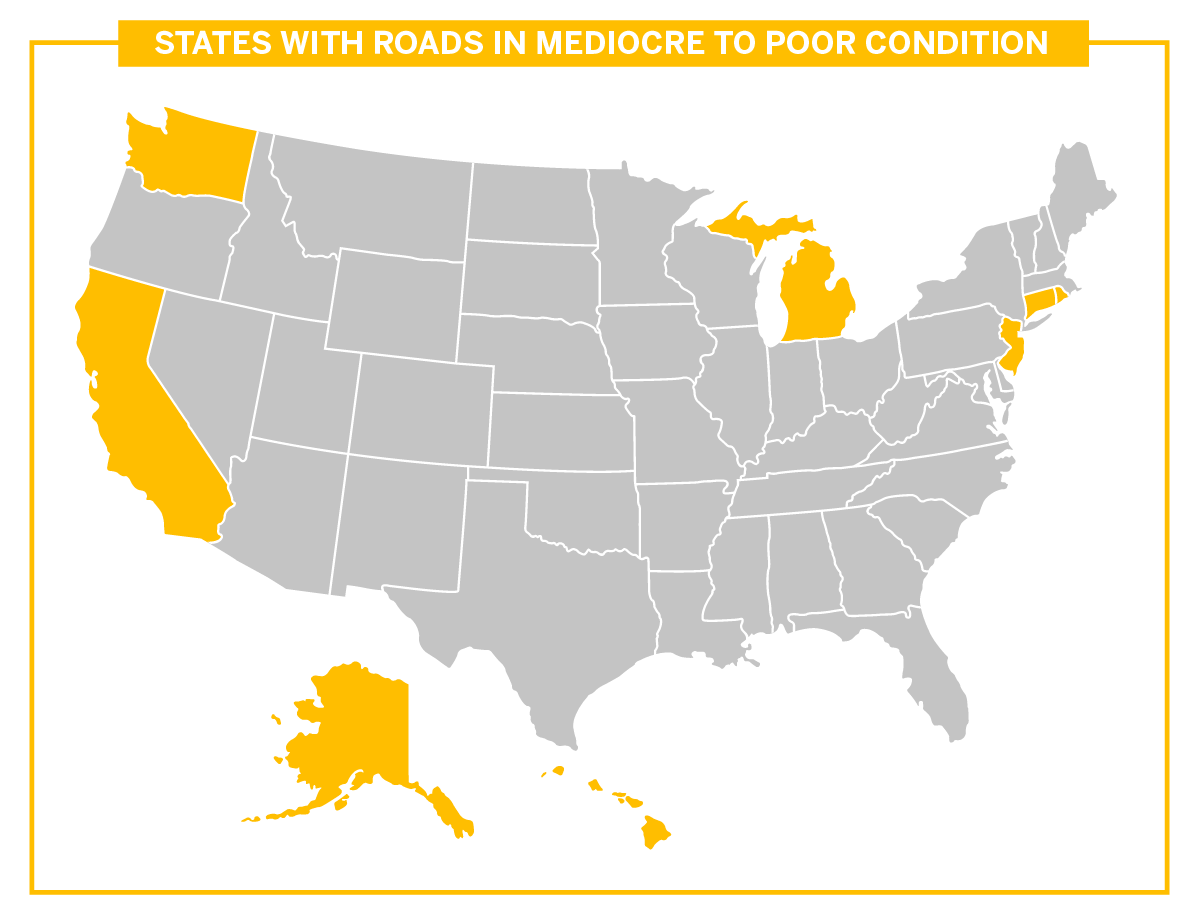
According to 2013 Federal Highway Administration (FHWA) data--the latest available--Connecticut has the worst roads in the country, with 42.1% of federal-aid highway miles in poor or mediocre condition. Not far behind are Hawaii (41.8 %) and Rhode Island (37.4%).

Other states with more than 30% of federal-aid road miles in poor or mediocre condition are New Jersey (36.3%), California (35.3%), Michigan (33.7%) and Washington (32%). Hawaii and Alaska have the worst Interstate Highways, with 31.5% and 10.5% of miles in poor or mediocre condition, respectively.
The state reporting the best road conditions, according to FHWA, was Nevada, with only 2.2% of federal-aid highway miles in poor or mediocre condition, followed by Nebraska with 2.5%. Other states with roads in relatively good condition include Iowa (3.2% in poor or mediocre condition), Florida (4.8%), Tennessee (5.2%), Arizona (6.4%), Minnesota (6.6%) and South Dakota (6.9%). The states with Interstate Highways in the best condition in 2013 were Kansas and Rhode Island, each reporting no miles in poor or mediocre condition.
A Statistics Canada survey also paints a picture of that country's road infrastructure. The 2016 study, conducted jointly with Infrastructure Canada, indicated that an average 17.1% of the country’s highways were rated poor or very poor.
Canada has more than a million kilometers of (two-lane equivalent) roads, roughly 38,000 of which make up the National Highway System. Canada's road network is shared by a wealth of different users, including 750,000 medium- and heavy-duty trucks.


